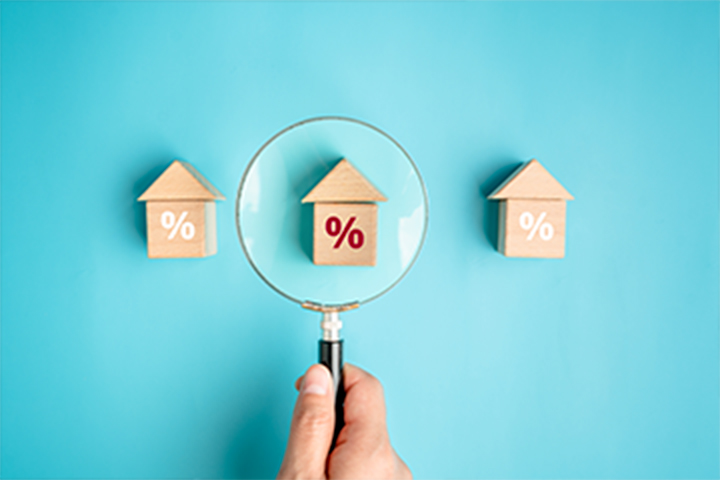
Rent or buy? How to use the price-to-rent ratio


Roel Vermeire
Content & PR manager Keytrade Bank
June 09, 2021
(updated June 29, 2022)
5 minutes to read
Residential sales prices have risen sharply in recent years, but rents have not lagged far behind.
Sale and rental prices in the Flanders Region: trends 2018-2020
| empty-header | empty-header | empty-header | empty-header | empty-header |
|---|---|---|---|---|
2018 | 2018 | 2020 | 2020 | |
Sale price (median) | Rental price per month (average) | Sale price (median) | Rental price per month (average) | |
Terraced and semi-detached housing | EUR 226,000 | EUR 811.5 | EUR 249,000 (+10,2%) | EUR 871.5 (+7,4 %) |
Detached housing | EUR 318,800 | EUR 1,302 | EUR 349,000 (+9,5%) | EUR 1,394.5 (+7,1 %) |
Apartments | EUR 185,000 | EUR 697 | EUR 210,000 (+13,5%) | 736 (+5,6 %) |
Sale and rental prices in the Brussels Capital Region: trends 2018-2020
| empty-header | empty-header | empty-header | empty-header | empty-header |
|---|---|---|---|---|
2018 | 2018 | 2020 | 2020 | |
Sale price (median) | Rental price per month (average) | Sale price (median) | Rental price per month (average) | |
Terraced and semi-detached housing | EUR 375,000 | EUR 1,518 | EUR 435,000 (+16 %) | EUR 1,718 (+13,2 %) |
Detached housing | EUR 847,500 | No data available | EUR 960,000 (+13,3 %) | No data available |
Apartments | EUR 199,000 | EUR 1,046 | EUR 228,000 (+14,6 %) | EUR 1,114 (+6,5 %) |
Changes in sale and rental prices in the Wallonia Region
| empty-header | empty-header | empty-header | empty-header | empty-header |
|---|---|---|---|---|
Sale price (median) in 2018 | Sale price (median) in 2020 | Rental price per month (average) in 2018 | Rental price per month (average) in 2019* | |
Terraced and semi-detached housing | EUR 140,000 | EUR 155,000 (+10,7 %) | EUR 617.5 | EUR 652.5 (+5,7 %) |
Detached housing | EUR 232,500 | EUR 254,000 (+9,2 %) | EUR 754 | EUR 790 (+4,8 %) |
Apartments | EUR 144,000 | EUR 155,000 (+7,6 %) | EUR 574 | EUR 564 (-1,7 %) |
* Data for 2020 is not yet available
Source of sale prices: Statbel, based on all deeds of sale registered with the General Administration of Assets Documentation, part of the FPS Finance.
Source of rental prices for the Brussels Capital Region and the Flanders Region: < ahref="https://www.cib.be/actua/6bd95fbe-a6e3-4e5a-a616-b793cb958871/cib-huurbarometer-huurprijzen-in-vlaanderen-met-2-3-gestegen-coronacrisis-heeft-hausse-in-brussel-afgestopt">CIB Rent barometer, based on more than 30,000 residential leases signed in 2018 and 2020.
Source of rental prices for Wallonia Region: Research Centre for Sustainable Living in Wallonia (2018) (and Research Centre for Sustainable Living in Wallonia (2019)), based on a survey of more than 4,000 tenants
What is the price-to-rent ratio?
If you’re planning to buy a house, it can be hard to know when is the "right" time to buy. There are many factors involved in making this decision. It is not enough to just make a comparison between the monthly rental costs and the repayment cost of a mortgage on a home. The price-to-rent ratio of real estate in your region is an additional tool that may help you.
This ratio is calculated by dividing the average house price by the average annual rent. The result is a number that indicates whether it makes financial sense to rent or buy. A result of 15 or less means it’s better to buy. A result of 21 or more means it’s better to rent.
Some examples:
EUR 295,000 (average purchase price) / EUR 11,000 (average annual rent) = 26.8 -> better to rent
EUR 375,000 (average purchase price) / EUR 36,000 (average annual rent) = 10.4 -> better to buy
EUR 450,000 (average purchase price) / EUR 25,000 (average annual rent) = 18 -> price-to-rent ratio is balanced
Where can you find the data to calculate the price-to-rent ratio?
To find the specific numbers for your region, you will need to do some research. For average house sales prices you can find detailed information at Statbel. The tables can be downloaded in Excel and you can find the information by region and municipality.
The average rents are not so simple. Detailed figures per municipality are available, but these relate to 2018. You can use these figures, but it’s a good idea to increase them a bit because rents have risen in the meantime - the tables above give you some indication.
Some local authorities also regularly publish a report on rents in their municipality. With a bit of luck, you will find this information on the website for the municipality you are interested in. Another option is, of course, to contact the municipal administration directly to ask whether the figures are available.
Of course, you could also use the annual rent you pay currently in your calculation and the asking price of the property you are looking at.
How to use this formula to reach a decision
You should not consider only the price-to-rent ratio to decide whether now is time to buy a house. The price-to-rent ratio only measures whether the market as a whole is more favourable to buyers or tenants. It’s an extra tool, not a miracle formula.
You also need to be ready to buy, which is quite independent of what the numbers tell you. The price-to-rent ratio in your municipality might tell you it’s a fantastic time to buy. But if you are expecting major changes in your income, or if you regularly set off in search of new horizons, you may be better off renting.
Planning to buy or renovate?
Run a simulation of KEYHOME: 100% online and immediately our best interest rate
Other articles that might interest you

How to choose a tracker?

Sell first, ask questions later? What conflicts do to the stock markets

Guide: how much you need in savings

A hassle-free guide to switching banks

Planning to live together or get married? What this means if your partner is in debt...

From siestas to sprints, the Spanish stock market surprises investors

What can you do if you find a hidden defect in your home?

Do you have a dormant account? This is how you can check!

Will AI replace human investment advisers?

Graph of the week: Industry has not succumbed to Trump!

When you are taking out a mortgage, make sure to take out this free insurance

Why you can take out a home loan too as a single person

Gift or inheritance? Avoid these 3 big pitfalls (and any unnecessary tension)

An offer, an option agreement or a contract: ending the confusion

Risks and opportunities in the energy sector

Taking out a loan for energy-saving renovations: what are your options?

New reductions in stamp duty for home buyers

Everything you need to know about the post-intervention file

How much can you borrow for a home?

A no-deposit mortgage loan: fact or fiction?

Age limit for a mortgage loan: is it true?

Borrowing for a second home: what are your options?

Property shares: ripe for a comeback?

What happens to the shared home when a relationship breaks down?

Helping your (grand)children to buy a home: what are the options?

Stamp duty and inheritance taxes are set to fall sharply in Wallonia

What to look out for when buying a home

Planning renovations? Which renovation grants are you (still) entitled to?

Rental income and taxes: what every landlord should know

After the gold rally, is it silver's turn?

Why the S&P 500 does and does not have a problem

Investing in future index constituents: opportunities and pitfalls

World Cleanup Day
Ever heard of the Zweig Breadth Thrust?

Humanoid robots: hype or golden opportunity for investors?
Defensive shares as a buffer?
US shares no longer number one!

One inheritance at multiple times: contingent legacies

Will there be a recession in the US?

As cruise companies gather steam, are their shares doing the same?

Your family member dies: how to manage their banking

Have the Magnificent 7 lost their magic?

Lending money to family or friends: do you have carte blanche?

What costs are involved in buying a home?

Has the obesity trade peaked?

How to invest in AI after the DeepSeek bomb

Married, cohabiting or in a non-cohabiting relationship: the impact on gifts and legacies

Writing your own will? Avoid these 10 mistakes

12 questions and answers about a lasting power of attorney

Want to fit in a gift before the end of the year and avoid paying gift tax?

Investors missed out on many great opportunities in 2024

40 years of pension savings: what will you spend it on (literally)?

From FOMO to ZERO bank account? 5x pension savings to the rescue

Pension savings returns: these choices give the maximum payout

What monthly pension savings for a maximum return?

Lifetime pension savings: the sooner you begin, the more you rake in

What if pension savings were like a dating app?

Myth busters: 5 myths vs. facts about pension savings

Pension savings: save the grey hair for later

Why pension planning is even more important for women

United States 1, Everyone Else 0

What would the retired version of you say to yourself?

Which loan is the best fit for your renovation project?

FIRE: how hot is this financial trend and how does it work?

How can you teach your child to save? 12 tips
A potential worldwide trade war is claiming European victims

Ever thought of investing in the pet industry?

Have a password manager on your cybersecurity checklist yet?
Have long-term interest rates once again started a 40-year uptrend?

Democrats or Republicans: which party is better for your investments?

Scam letters are back (even though they never really went away)
Graph of the Week: Magnificent 7 vs 2000s Tech Bubble
Investing at new highs is an elevated idea

5 mistakes investors make in volatile markets

Government bonds, savings accounts, or term accounts: which should you choose?

Checklist: travel without any money worries

Investing in Belgian shares: the dangers of too many domestic securities

Investors, never pay too much for your favourite share!

Would it be better to buy a student room than rent one?

House flipping: is it worthwhile?

Investing in dividend shares: what to look for?

What your friends forgot to tell you about cheaper travel

Why high dividend yields can be a poisoned chalice
Comparing savings accounts: where do you put your money?

3 ways to invest when you don't have much time.

Watch out for recruitment scams

Is it time to invest in Chinese stocks again?

How do you select an investment fund for your child?

Opening an online bank account: what is holding you back?

Will ultra-low interest rates make a comeback? Probably not…

Robotics: From science fiction to science

How to recognise investment fraud

Are money market funds an attractive investment?

Is it the right time to invest in bonds?

Stock market records: some down-to-earth advice on how to respond to dazzling heights

Have you ever thought about investing for your children?

Online dating scams: tips to protect yourself

How can you invest in space travel?

How do you protect your smartphone from hackers?

Shopping online: 7 tips and points to consider

Five myths about sustainable investing

How can you invest in an ageing population?

6 reasons why installing solar panels is still worthwhile in 2024

How do elections affect the stock market?

8 questions and answers about holding companies

Nigeria: a new hot spot for adventurous investors?

Investing in emerging markets: are investment funds a smarter buy than trackers?

How to invest in the energy transition?

Read this before you scan another QR code

How to put phishers out of a job

Is India the new China?

Which sectors should remain overweight following the latest rate hike?

8 timeless rules for investors

Get ready for the last quarter!

Saving for the sake of saving? Or with a goal in mind?

How do you prepare financially for a longer life?

Handling recessions: a manual

How to navigate a relationship with lopsided incomes?

Avoiding and dealing with conflicts on financial matters: a guide

Sell in May? Is it really such a good idea?

Investors, keep your emotions in check!

How natural disasters affect the economy and the markets

Money management in a new blended family: a step-by-step plan

1 account for the both of you? Or separate accounts? Or a combo?

It is impossible to disinherit your child in Belgium: fact or fiction?

How much diversification is enough for your portfolio?

From KIID to KID: new rules, better investment decisions

Which investment opportunities are available on the road to smart mobility?

Is the end nigh for American dominance?

A vitamin shot for your investments

Does water earn a place in your portfolio?

What is the difference between a tracker and a fund?

Bonds to rise in 2023?

“The headwinds should ease up in the second half of 2023”

“More chaff will be separated from the wheat on the stock exchanges”

2022: 840 000EUR in bonuses and (a higher interest rate on your savings account)

Museum of Circular Economy: what’s next?

A recession and yet the markets are going up?!
What is technical analysis and how does it work?

The situation following the Russian invasion of Ukraine

6 points to consider for thematic investing

Property transfer tax – how much is this tax?

Is tighter monetary policy acting as a brake on the stock market upturn?

Belgian traders tempted by American stock market rush and Reddit investors

With or without the coronavirus: why green investing remains just as relevant as before

Impact investing: sustainable investments with that little bit more

How much additional income are you allowed to earn as a pensioner?

All in our fund market at the same price

How to invest if you're on a tight budget

This is what the tax authorities know about your money
Investing in dividend shares: what to look for?

Hate budgeting? This is your guide to budgeting

Podcasts about money and investments (part one)

Can countries go bankrupt?
Could there be a little more of using a little less?

Which investment style and which regions would benefit from renewed growth in interest rates?

Inflation? Grab some commodities for your portfolio!

Which shares will be the rising stars once interest rates start increasing again?

Gold, cash and government bonds: how safe are safe havens?

What is fundamental analysis, and how does it work?

What do I do to balance my investments?
The impact of luck on investments
Are you investing really globally with a tracker on a world index?

Are we heading into a year-end rally by the stock markets?

Coronablog de Geert Van Herck: La panique atteint des sommets… énième épisode

Emerging countries are lagging behind!

First Aid for Your (Financial) Administration

Tips from an expert: how to keep your passwords safe
Coronavirus blog Geert Van Herck: Property once again fails to deliver diversification bonus

Making an offer on a property: what should you look out for?

Swapping your car for a bike: how much money could you save?

Can China make the dollar crash?
Afraid of causing Ferrari or hammock syndrome? This is how you can make a gift and stay in control

Are trackers the latest bubble on the financial markets?
Podcasts about money and investments (part two)

Anxious about inflation? Have you ever considered the mining sector?
What does higher inflation do to your savings and investments?
How can you invest successfully?

Which shares suit you?


