Ever heard of the Zweig Breadth Thrust?

Geert Van Herck
Chief Strategist KEYPRIVATE
May 26, 2025
2 minutes to read
The international stock markets have grown a lot more nervous and volatile since April. The reason for this can be found in the United States, of course. First, President Trump's announcement of higher import tariffs caused the stock markets to fall.
A few days later, the President changed tack and decided to introduce a 90-day cooling-off period to stem market panic. This led to a spectacular turnaround on the international stock markets.
The losses incurred in early April have almost been completely erased, and investors are now wondering whether the worst is behind us. Could the stock markets continue to rise in the coming weeks and months?
We can answer this question by considering a key technical indicator reflecting changes in market sentiment: the Zweig Breadth Thrust indicator developed by Martin Zweig. This indicator may not be a TikTok hype, but it is a very valuable tool for detecting trend changes.
So how does it work?
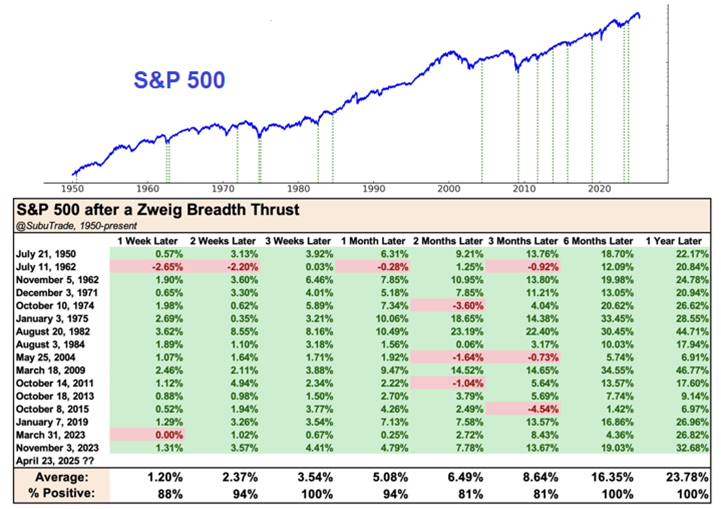
The indicator calculates a ten-day moving average of all advancing shares on the US stock market, and if that average rises from a level below 40% to above 61.5% over a period of 10 days, a Zweig Breadth Thrust occurs.
As an investor, what you need to remember is that this indicates a sudden shift from bearish to bullish. It is therefore a sign that many buyers are eager to buy.
The indicator has an impressive track record. It has been triggered 16 times since the 1950s and has resulted in double digit returns in the 6 and 12 months afterwards each time. It has a 100% success rate.
S&P 500 performance after a Zweig Breadth Thrust

Source: Subu Trade
We have also noticed widespread participation in the recent stock market rise. This means the rise is not being driven by a limited number of large players, usually tech companies. We see that all major sectors are participating in the stock market rise. This is a positive sign,
but we do need to remain cautious, as even well-founded predictions do not always prove accurate on the stock market.
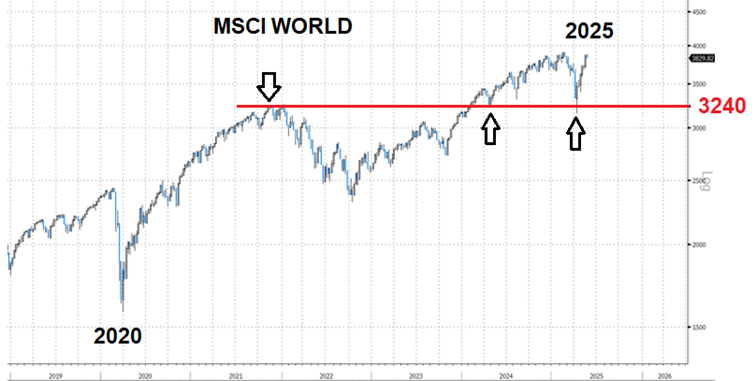
We would therefore like to draw equity investors' attention to the important MSCI World index support level of 3240.
Graph two shows that this level was at its market peak in 2021. Then, in early 2023, the index broke above this resistance level, which made it an important support level for the market. The corrections of 2024 and 2025 all came to a halt around this level and share prices have recovered since then. As long as the MSCI World index remains above this level, we see no reason to reduce our equity exposure.
MSCI World weekly graph

Source: Bloomberg
Conclusion
The prediction that Donald Trump's election as President of the United States would cause increased volatility on the markets has already come true. However, Trump also wants to avoid excessive downward shocks on the American stock market. This made him change tack after the sell-off in early April. This led to a rise in share prices characterised by broad participation. At first glance, this bodes well for the coming weeks and months.
However, long-term investors also would do well to keep an eye on the MSCI World index. As long as we stay above the 3240 support level, all seems to be fine on the international stock markets.


