Are we heading into a year-end rally by the stock markets?

Keytrade Bank
keytradebank.be
December 19, 2021
(updated January 24, 2022)
4 minutes to read
In 2021, September once again lived up to its reputation as a bad month on the stock markets. Worldwide, stock markets fell between more than 5% to as much as 10% during this month. However, the stock markets have got back to their upward trend since the start of October. Should investors prepare for a year-end rally? If you were to ask us, we would say yes.
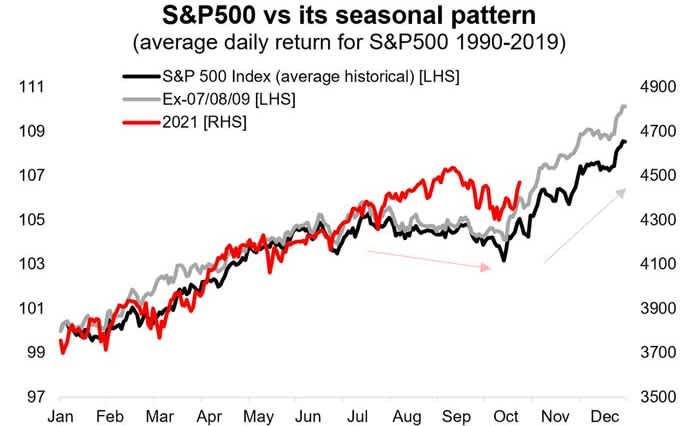
Our first argument for a year-end rally is the annual movement in the S&P 500. As a gauge of the US market (this index includes shares such as Apple, Amazon, Tesla, etc.), it also provides the benchmark for the rest of the world. The fact is that once Wall Street heads down or rises sharply, the rest of the world will follow.
Diagram 1 shows the annual performance of the S&P 500 based on its past monthly performances. The black line shows the annual trend since 1990. Can you see the dip between May to September ("...sell in May and go away...")? Can you also see the rise in the last few months of the year? Given that so far this year the movement of the S&P 500 has followed the annual pattern nicely... Let’s keep our fingers crossed that this pattern will continue!
Diagram 1: S&P 500 annual pattern
Source: Topdown Charts
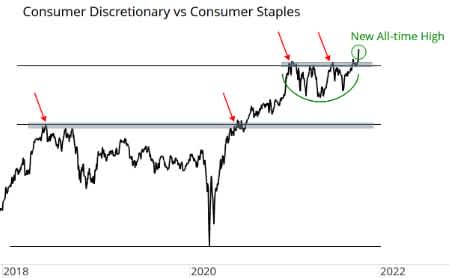
As a second argument, we offer you the relative performance of cyclical versus defensive sectors. The cyclical sector is represented by discretionary consumer purchases, including car manufacturers and department stores. For the defensive sector, we picked food and beverage manufacturers (Coca Cola, Nestlé, etc.). Diagram 2 shows that the cyclical sectors started to recover strongly in April 2020. For most of 2021, we found ourselves in a horizontal consolidation, but the index recently broke out upwards. More specifically, this means that cyclical sectors are outperforming defensive sectors. This is a sign that investors are not feeling defensive. Otherwise, they would be mainly picking shares from the defensive food and beverages sector. They are now opting for cyclical stocks that are profiting from higher consumer spending worldwide. Consumers tend to loosen their purse strings when the economy and employment are moving in a favourable direction.
Diagram 2: Cyclical versus defensive sectors
Source: All Star Charts
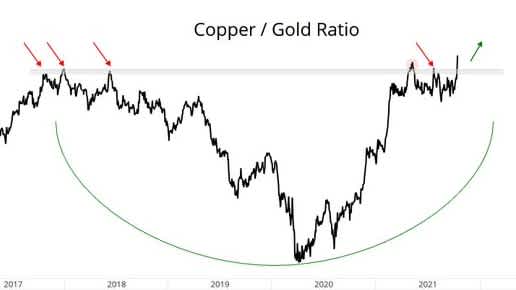
Our third argument backs up the previous one. On the commodities market, copper is breaking new records compared to gold. This can be seen nicely in Diagram 3.
Investors appear to prefer to invest in copper rather than in defensive gold. We believe this reflects the risk appetite among investors. Investors do not normally enter the copper market if they are feeling gloomy about the future. When they see the future as being less rosy, they usually go for gold. Note that Diagram 3 is almost identical to Diagram 2.
For us, this is clear confirmation that the financial markets are shifting from defensive investors (as in the period between 2017 and spring 2021) to offensive investors (in the period since spring 2021). As an investor, it’s important to track and benefit from these trends!
Diagram 3: Copper price vs gold price
Source: All Star Charts
Conclusion
The financial markets are sending us a number of signals. After the dip in September, investors are again likely to turn to more risky equity sectors and asset classes in their portfolios. A year-end rally seems to be in the offing. We would also like to point out that, in this market environment, investors with a diversified portfolio would do well to prioritise cyclical shares such as car manufacturers and mining industry companies.
Geert Van Herck Chief Strategist KEYPRIVATE
