Going for gold? Gold is apparently going for it.

Keytrade Bank
keytradebank.be
December 23, 2021
(updated January 24, 2022)
4 minutes to read
The gold price hasn't yet been reflected in the outliers of 2021. Yet this year saw a sharp rise in inflation around the world. Meanwhile other commodities (such as copper and oil) were performing well. Many disappointed investors seemed to have turned their backs on gold, leading to a highly negative sentiment.
Yet this can be an ideal environment to reverse the trend, with gold apparently being the in-thing once more.
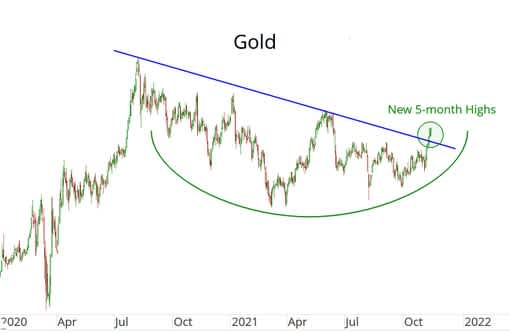
Figure 1 clearly shows why we are more optimistic about the price of gold. Gold has been in decline since mid-2020, which is reflected by the decreasing resistance line that connects the peaks of 2020 and 2021.
However, we now see that the gold price is starting to rise above this resistance line. In our opinion, this is clearly a positive sign as it shows that buyers are returning and pushing up the price. If we can also surpass the peaks seen in April of this year in the months ahead, gold really will be on the up. If this rise continues, 2022 could well be a very good year for gold.
Bear in mind, though, that positive sentiment towards gold is also likely to affect the gold mining and silver sector.
Figure 1: Gold price

Source: All Star Charts
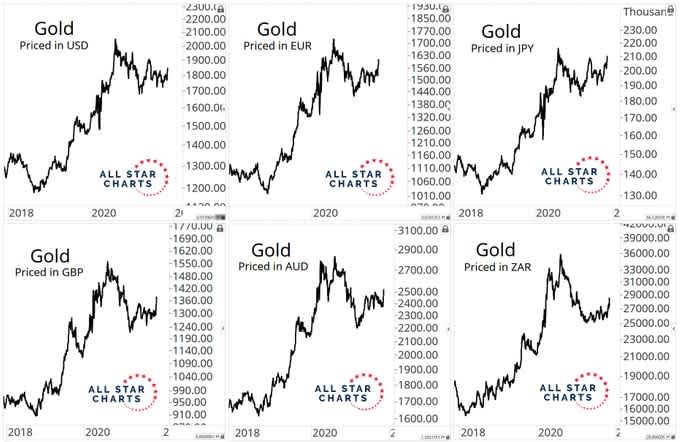
Another striking observation is that gold is currently rising in all major world currencies, as shown in Figure 2, whether denominated in euros, Japanese yen, British pounds or another currency. In all key regions, gold is attracting new buyers who are rapidly pushing up the price of the precious metal. If we see a return to the record highs seen in mid-2020 or an upwards trend to new levels, this will confirm that we are seeing a structural rise in the gold price.
Figure 2: Gold in different currencies

Source: All Star Charts
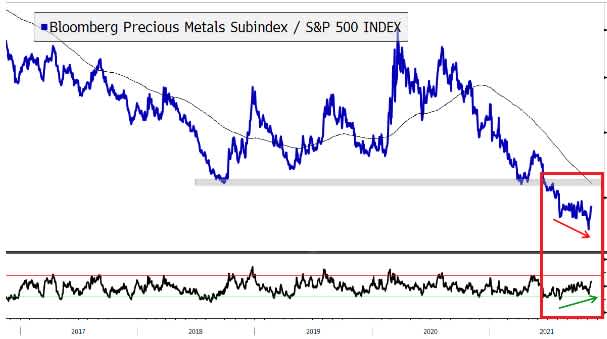
Finally, Figure 3 shows a key reason for our optimism. This relative graph shows the performance of gold (which has a weight of more than 50% in the Bloomberg Precious Metals Index) compared to equities (S&P 500). Rising trends show gold outperforming US equities, while declining trends show the opposite. The last favourable period for gold was from mid-2018 until mid-2020. Thereafter, it was much better to invest in US equities.
Here, too, we have seen a turnaround, with the red box on the right-hand side of the graph indicating a rebound. All the signs point to gold once again outperforming the US stock market.
Without wishing to get too technical, the black line at the bottom shows the RSI indicator, which tells us whether the market is oversold or overbought.
Take a look, however, at the green line beneath the RSI indicator. Recently, the relative chart (blue line, top chart) reached a new low while the RSI indicator (black line, bottom chart) climbed. For those who love the details, this is a pattern that often occurs with a trend reversal.
Figure 3: Precious metals compared to US equities

Source: Bloomberg
Conclusion
2021 seemed to be looking like a disappointing year for gold investors. Even accelerating inflation in the major economic regions couldn't make gold attractive.
Yet in our opinion, you could see a turnaround in the last few weeks of the year. Gold once again appears an attractive proposition and should be able to take a more important position in a diversified portfolio.
Geert Van Herck Chief Strategist KEYPRIVATE


